It’s Good to Talk. If you’re as old as I am, you’ll remember the British Telecom (as BT was then known) TV adverts with this tagline. It was an incredibly effective advertising campaign which helped change consumers’ perceptions of the organisation.
As it so happens, the same tagline is relevant to the sales and account management communities too. Let me explain by using an example from the corporate banking world.
Relationship Managers
Corporate banks don’t employ account managers to manage their major accounts. They employ Relationship Managers or RMs. Words are important. Banks tend to take business relationships more seriously than other industries. This is partly because an intimate knowledge of the customer is critical when making lending decisions.
One of our clients is a large European bank. The MD of the Corporate and Business Banking division prides himself on the level of service provided to his customers. For him, service begins with regular contact. The vast majority of corporate and business clients see their RM every three months or more frequently.
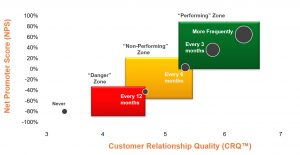
The MD asked us to test this, so we did. We asked his clients how frequently they saw their RM. A small percentage (4%) of the bank’s clients claim they never saw their RM and a similar number said they met the RM annually. 9% saw their RM every six months; 22% every 3 months and the majority (56%) said that their RM was in contact with them on a more frequent basis.
What we hadn’t predicted was that frequency of contact has a huge impact on the quality of the banking relationship. We call this Customer Relationship Quality. It also has a huge impact on the bank’s Net Promoter Score (NPS).
It really is good to talk
A quick analysis of Net Promoter Scores by frequency of contact is telling.
The bank’s overall Net Promoter Score is 28% which, for European B2B companies is good (see another blog here).
When RM visits are conducted only on an annual basis, or not at all, the Net Promoter Score is deeply negative – minus 70% for the 4% of clients who claim they never see their RM.
However, for the majority of clients who are in contact with their Relationship Manager every 1-2 months, the Net Promoter Score is a whopping +51%.
There is a very simple message here. If you want to have better relationships with your clients, go and talk to them more frequently than you currently do.
Get in touch with us today if you want to find out a little more about customer centricity.
If I got a penny for every time a client has asked “How do we compare against our competitors?” or “How are we doing against the benchmark for our industry?” I’d be a rich man. But the thing is that B2B benchmarking is not a good idea.
Seriously. You should strive to be a ‘Unique’ company and not an average company.
Most of our clients want to know how they are doing against the benchmark score for their industry. My response: “If you really aspire to being a mediocre company, then I’ll tell you what the average score is for your industry and how you compare against the average. But you can do better than that. You can be UNIQUE.”
In fairness, some of our clients have latched on to the message that they should ignore the competition. They should focus purely on being indispensable to their existing customers. Still, it’s tempting to see where you stand in a league tables against your industry peers.
So let me ask a few questions about why you want to do benchmarking. Because B2B benchmarking is not a good idea!
What exactly is your industry?
Are you in the insurance industry, or the insurance broking industry? Or are you in both? Or re you an outsourcing company that specialises in insurance third-party processing?
They’re all in the insurance world but these are very different industries. They have different dynamics and there are differences in average scores from one industry to the next. For example, we know from experience that many IT and most BPO (Business Process Outsourcing) companies tend to get lower than average scores, while corporate banking and professional services companies tend to get higher than average scores. Firms operating in niche markets also find it easier to be seen as different and unique.
If I say you’re at the industry benchmark, will you really be happy?
If you aspire to hit the average score for your industry, or your country, you’re setting the bar pretty low. What you’re telling me is that you want to be an average company.
To take my point to its extreme, benchmarking is little more than a recipe for mediocrity.
Do you realise that international benchmarks are inherently flawed?
This is not just because the insurance broking or widget-manufacturing markets in the Netherlands have a completely different structure than they do in Australia. It’s also because Dutch and Australian clients have completely different approaches to the way they answer customer surveys.
There are some good academic papers on how different nationalities are pre-disposed to answering questionnaires differently. Let me give just one example. Some people will claim that the average Net Promoter Score (NPS) for B2B companies is between 25% and 30%, regardless of industry. However, these figures are heavily skewed towards US companies.
Our experience of gathering NPS scores across 86 different countries since 2006 is that the average NPS score for any B2B industry is closer to 10%. But then again, our clients are more heavily weighted towards European and Australian respondents, who generally tend to score less positively than their American counterparts.
But I still want to benchmark my performance!
I thought you might say that.
If you really do want to benchmark yourself, then let me suggest that you approach the subject of benchmarking in a slightly different fashion:
START BY SETTING THE BAR HIGHER. Aspire to be the best, or at the very least to be ‘Unique’ in the eyes of your customers. Our database at Deep-Insight shows that only 10% of B2B companies are considered Unique by their clients, but these Unique companies have significantly stronger relationships – and retention rates – than the ‘average’ company. Unique companies typically have twice the number of Ambassadors and have NPS scores of 30% or more.
BENCHMARK YOURSELF AGAINST YOUR OWN PERFORMANCE LAST YEAR. That’s a much more reliable way of seeing if you are becoming more customer-centric or not. The journey to becoming a customer-centric organisation is a long one – don’t think you’re going to achieve it in anything less than three years – so be sure to check your progress formally on at least an annual basis.
BENCHMARK YOURSELF INTERNALLY. See what your clients think of you, compared to the scores that are achieved by other divisions or business lines within the same company. If you’re an international company, benchmark yourself against other geographies (but watch out for the cultural differences between, say, American and European divisions.)
Remember that B2B benchmarking is not a good idea. It’s not a BAD idea. It’s just that you should ignore the competition and become unique for your customers.
Most of Deep-Insight’s work is based on helping large international B2B organisations run effective Customer Experience (CX) programmes.
The key to running a good CX programme is understanding how to change the culture of an organisation to make it truly customer-centric, and that has to be based on regular high-quality conversations – both formal and informal – with your B2B clients.
Without regular client feedback, sales directors and account teams will not be in a position to address small issues before they escalate to a point where they damage or destroy the client relationship.
When we plan Customer Relationship Quality (CRQ™) assessments for our clients, one of the questions I regularly get asked is “How many of our clients should we sample?” The stock answer that I’ve been using for the past decade is “Think Census, Not Sample”. In other words, get feedback from your entire client base – every single one – and it’s the answer I still use.
It’s not meant to be a glib response but there are a few subtleties underpinning the answer that are worth exploring.
TRADITIONAL APPROACH TO SAMPLING
Many market research and customer insight people – even in B2B organisations – tend to approach the subject of customer feedback from a consumer perspective, where there are tried and trusted approaches for surveying large customer bases, or “populations” to use the technical term. If you’re not that familiar with these approaches or terminology like random sampling, margins of error and confidence levels, have a look at the Box below.
MARGINS OF ERROR, CONFIDENCE LEVELS AND SAMPLE SIZES – TRADITIONAL APPROACH
If you’re not a market researcher or statistician, don’t worry – there are plenty of good primers on the Internet explaining the basics of sampling techniques and associated terms – here’s one from YouGov.
You’ll also find several handy little calculators on the Internet (here’s a link to one) which let you know how many respondents are required for a particular population (customer base) in order to give a confidence level and margin of error. From this, it’s easy to calculate the number of individuals you need to invite to participate in a survey in order to get a robust answer.
Most opinion polls are conducted with a random sample of at least 1,000 people and here’s the reason why: pollsters like to be confident that their results are within a margin of error of 3% or less. Supposing the voting population in a country is 10 million people. Plug that number into our online calculator and we see that a 3% margin of error and a confidence level of 95% requires a sample of 1,067.
All that is fine if you’re working in a consumer environment or if you have tens (or hundreds) of thousands of SME customers. However, the traditional sampling techniques have less value when you are a B2B organisation and the vast proportion of revenues is generated by a handful of large clients. There may be a “long tail” of smaller customers but in most cases the Pareto Principleapplies, whereby 80% of revenues are generated by 20% of clients. In some cases, the ratio can be 90/10 rather than 80/20. In such cases, the old traditional sampling approach needs to be chucked out of the nearest window and a different set of principles applied.
THE DEEP-INSIGHT APPROACH – FOLLOW THE MONEY
Our approach is to be pragmatic and follow the money – concentrate on those clients that generate the majority of the revenues, and do a ‘deep dive’ into those relationships.
It’s probably easier to explain using an example.
Case Study – Large UK Services Company Revenues: Over £1 billion Key Clients: 100 One of Deep-Insight’s UK clients has over 10,000 employees and generates annual revenues in excess of £1 billion. However, its customer base is actually quite small and the contracts it has with these key clients are extremely large. The company has several hundred clients in total but the vast majority of its revenues come from the ‘Top 100’ and even among the ‘Top 100’ the revenues are skewed heavily towards the 10 largest clients.
So how do you run a CX programme when your client base looks like this? In that particular case, the company has chosen to focus exclusively on its ‘Top 100′ clients. Purists might argue that this is not representative of the full customer base. This may well be true but it definitely is representative of the full revenue base, and that’s the commercial perspective of “following the money.”
From a pragmatic perspective, it makes little sense to take a sample of the Top 100 clients. You should attempt to get feedback from every single one and ideally you want to get a wide representation of views from across each of those 100 clients.
Even from a statistical perspective, it makes little sense to sample – if you need convincing, have a look at the second Box below.
APPLYING THE DEEP-INSIGHT APPROACH
Suppose there are 10 key individuals (at most) in each ‘Top 100’ client whose feedback is really “important” (in other words, the decision-makers who will renew the current contract when it’s up for renewal) that’s still only a population of 1,000 individuals across your Top 100 clients – run the numbers and you’ll see that you need to include all, in order to get a statistically significant sample.
Let’s plug those figures from our Case Study into the online calculator and see what happens.
For a population of 1,000 decision-makers, we need 278 responses to get a robust score (robust being a margin of error of 5% and a confidence level of 95%). Deep-Insight will typically achieve completion rates of 35-40% from its online B2B assessments so that means we need to invite 700-800 of those 1,000 key individuals to participate.
If you think a margin of error of 5% is too high, then plug in 3% into the online calculator. Now the number of responses jumps to 517 out of 1,000. This means you DEFINITELY need to invite all 1,000 to participate to get anywhere near your target margin of error.
Successful CX programmes in B2B companies are not built around statistics. They are built around empowering staff and providing account managers with all the customer feedback they need to manage client relationships more effectively. That means getting feedback from ALL individuals in those key clients and working really hard with the account teams to get participation and completion rates as high as possible.
So when you’re planning your next Customer Relationship Quality (CRQ™) assessment, remember to get the account managers involved and “Think Census, Not Sample”.
We’re coming to the end of another year and all in all, it’s been a good one for us here at Deep-Insight.
We are an Irish company – and proud of it – but our client base is international. Over the past 12 months, we have carried out customer and employee assessments in the UK, Netherlands, Poland and Australia as well as in our home market. That said, one thing that I have noticed in 2015 is a marked increase in activity from local companies. The Irish recovery is definitely under way.
NEW FACES
We’ve had a particularly busy year at Deep-Insight and as a consequence, there are a few new faces in the Cork office these days.
We’re delighted to welcome Jamie Jaggernauth, who is our latest addition to the Deep-Insight team.
Jamie hails from Trinidad and has worked in a variety of research roles in the Caribbean, UK and Ireland before joining Deep-Insight.
NEW CLIENTS
We also added a few new names to our client list during 2015, ranging from large well-established firms like the health insurer VitalityHealth in the UK to newer digital organisations like DoneDeal, which is Ireland’s biggest classifieds site (and which is part of the Norwegian-headquartered Schibsted Media Group).
In fact, DoneDeal celebrated its 10th birthday this year so a big happy birthday to John, Cathal, Kristian, Simon and the rest of the DoneDeal crew!
DEEP-INSIGHT’S OWN CUSTOMER ASSESSMENT
Earlier this month, we asked you what you thought of your relationship with us.
Now, I must admit I awaited these result with some trepidation. We think we deliver an excellent service to our clients but it’s always slightly scary waiting to hear what people ACTUALLY say about us and the benefits of working with Deep-Insight. It’s scary because we do take your feedback personally and it’s always a little nerve-wracking waiting for the results ton come through.
Last year, we had a Customer Relationship Quality (CRQ) score of 5.2 and a Net Promoter Score (NPS) of 17%. I was a little disappointed with those scores last year as they were down from the scores we received on our previous assessment and I felt that we could – and should – have done better.
A NPS of 17% is above average (more on average and good Net Promoter Scores here) but frankly it’s not that much above average. We had significantly higher scores in the past and we don’t see ourselves as a “slightly better than average” company. We used to be regarded by our clients as ‘Unique’ but in 2014 we dropped out of that zone. It’s a bit like a restaurant losing its Michelin Star – I was extremely keen to see if we could get back into the top bracket again this year.
So how did we do? How did you rate us?
2015 CLIENT FEEDBACK
This year, you gave us a Customer Relationship Quality (CRQ) score of 5.7 and a Net Promoter Score (NPS) of +37%.
I was a little stunned when the results came through as our NPS and CRQ scores had shot up dramatically. As many of you will be used to hearing me say at this stage, it’s quite a challenge to get your CRQ score to jump by more than 0.2 or your NPS to increase more than 10%. We had worked hard on a number of fronts over the past 12 months but the size of the improvement in scores still came as a surprise. So thank you for that vote of confidence in Deep-Insight – it really does mean a lot to us.
The other thing I’m particularly pleased with is the fact that we are back into the ‘Unique’ zone – that’s the light green box in the top right hand corner of the graphic. To be seen as unique, a company has to be able to provide a solution that truly solves its customers’ problems, as well as providing an excellent experience for that client. That’s something that only 10% of B2B companies achieve so it’s nice to be able to claim that accolade again.
There’s still plenty for us to work on. We’re currently analysing each and every verbatim to figure out exactly how to improve our service even further. We will be sharing these results with you as early as we can in the New Year.
LOOKING FORWARD TO 2016
So there it is. 2015 is nearly over but we have some exciting things planned for next year.
Over the past few months, Rose Murphy has been talking to most of you about what you like and dislike about our current product offering. The feedback you have given to Rose, as well as the various suggestions you have made in this recent client assessment, will help us improve what we do and how we do it.
But for the moment, allow me to say a big thank you to each and every one of you for supporting us throughout 2015.
On a personal note, I’d also like to say a big thanks to the following (in no particular order other than alphabetical): Brian, Frank, Grainne, Jamie, Mark, Mary, Peter, Pim, Rose, Yvonne as well as to the rest of the wider Deep-Insight team who have helped to deliver a fantastic service to you – our clients – over the past 12 months.
Have a very peaceful Christmas and I look forward to seeing you all in the New Year,
Last year, I wrote a blog post entitled What is a ‘Good’ B2B Net Promoter Score?. For some reason it turned out to be surprisingly popular. The blog still gets dozens of hits every week. I’m guessing that was because there’s a lot of nonsense posted on the Internet about companies achieving Net Promoter Score (NPS) results of +62 or even +78, or about people being hugely disappointed because they only achieved a score of +25.
Meanwhile, some of our own clients at Deep-Insight would get upset when I tell them their customer NPS was only marginally positive or – even worse – negative. The two simple messages in that blog post were:
“Be careful about how you interpret NPS figures”
and
“A customer Net Promoter Score of approximately +10 is the average for European B2B firms.”
eNPS versus NPS
In that blog, I was discussing NPS as a measure of customer advocacy. More and more, it is also becoming the de facto standard for measuring employee advocacy and employee engagement. So this blog will address the question: “What is a ‘Good’ Employee Net Promoter Score?”
Before I let you know what that magic number is, it’s worth digressing slightly to explain the basics of how NPS is calculated. If you’re already a net promoter aficionado, skip the box below.
HOW IS THE NET PROMOTER SCORE CALCULATED?
For the uninitiated, a company’s Employee Net Promoter Score (eNPS) is based on the answers its employees give to a single question:
“On a scale of 0 to 10, how likely are you to recommend Company X to a friend or colleague?”
Employees who score 9 or 10 are called ‘Promoters’. Those who score 7 or 8 are ‘Passives’ while any employee who gives a score of 6 or below is a ‘Detractor’. The actual eNPS calculation is:
Net Promoter Score = the percentage of Promoters minus the percentage of Detractors
Theoretically, companies can have a Net Promoter Score ranging from -100 to +100.
So think about it. The only Promoters you have in your company are those employees who are prepared to give you a score of 9 or 10 out of 10. In the average American company (remember that the whole Net Promoter concept originated in the USA) that makes sense. Americans tend to score very positively when they are satisfied, so having a high cut-off point is appropriate. However, if you’ve grown up and live and work in a European country, you approach the Net Promoter question from a very different cultural perspective.
It’s a Cultural Thing
Many – nay, most – Europeans regard 8/10 as a very good score. Some will argue that 9s or 10s are only handed out in exceptional circumstances. This is culturally ingrained into us Europeans through our schooling system and particularly through our university grading system.
In European universities, a First Class Honours degree requires a score of 70% (7 out of 10). Scores of 75% are remarkable, while scores of 80% (8 out of 10) and higher are almost unheard of. These cultural differences have to be taken into account when interpreting whether a particular Employee Net Promoter Score is ‘good’ or ‘bad’.
The Magic Number
So what is a ‘Good’ Employee Net Promoter Score? We have been measuring NPS and eNPS since 2006. We do this mainly for European and Australian companies. The average Employee Net Promoter Score (eNPS) across all of our clients during that time has been a paltry -10. Yes, that really is a negative sign before the 10.
MINUS TEN!
Put it another way: achieving a positive Employee Net Promoter Score is a solid achievement for most European firms. Rarely do we see eNPS results in excess of +20.
So there you have it. If your company has just received a negative eNPS in the latest employee survey, don’t feel too bad. You’re in good company!
To find out more about Deep-Insight’s employee assessments, click here.
* Net Promoter® and NPS® are registered trademarks and Net Promoter SystemSM and Net Promoter ScoreSM are trademarks of Bain & Company, Satmetrix Systems and Fred Reichheld