Why are Trust and Commitment so Important in B2B?

Trust and Commitment

The following words are from two American academics Rob Morgan and Shelby Hunt. We’ll come to these guys shortly.

——————————————————

“Commitment and trust, rather than (or at least in addition to) power and dependence, are now central to discussions of business relationships.

Researchers and practitioners have come to view most interactions between business parties as events that occur over the course of a relationship between two or more partners.”

——————————————————

Here’s a funny thing about business-to-business (B2B). It’s less about business and more about relationships. In fact, B2B is really P2P: person-to-person. People buy from people. In large organisations, the decision to go with one particular service provider over another is often down to the answer to one simple question: “Do I really want to work with this person?”

The answer to that question is usually based on the perception of whether the individual can be trusted or not. Without trust, there can be no commitment.

Does NPS Work for B2B Companies

I thought companies bought mainly on price?

Companies generally put large business contracts out to tender. They will produce a clear set of evaluation criteria to help guide their choice of service provider. Price is always one of the evaluation metrics. Even so, the final decision is often made on softer and unwritten criteria. Price is rarely the deciding factor. Often, they are made on a combination of price and solution/ functionality. But when it comes to making the final choice to award any contract, subtle psychological elements come into play.

“OK, I know these guys seem to have the [INSERT: ‘best product’, ‘lowest price’, ‘most innovative solution’]. But what if it all goes wrong? Will they sort out the issues or will they leave me in the lurch? Will I lose my job?”

Fundamentally, we like to buy from people we think are honest, who treat us fairly and who act with integrity. In other words, we buy from people we trust. Price is generally a secondary consideration. It can’t be ignored but rarely is it the most important factor in the decision-making.

Morgan and Hunt

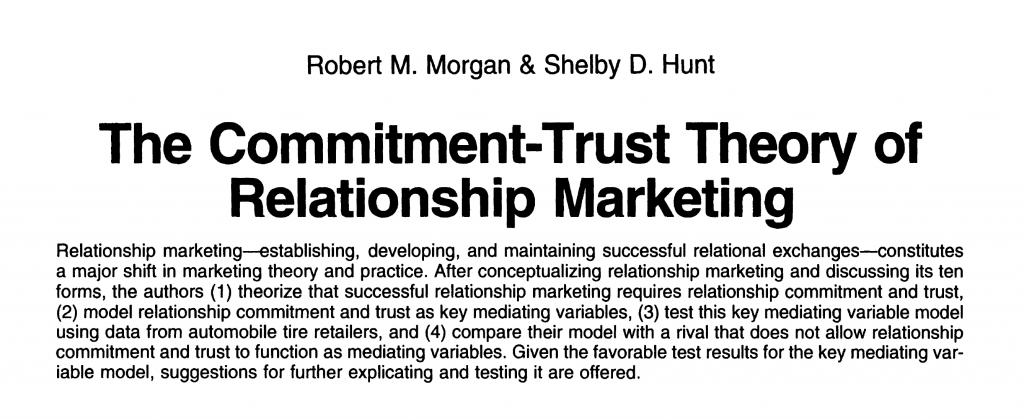
Two American academics figured this out a long time ago. In 1994, Rob Morgan and Shelby Hunt wrote a seminal paper on what really drives a long-term relationship between two business partners.

The Commitment-Trust Theory

The Commitment-Trust Theory of Relationship Marketing quickly became a hit, not just in academic circles, but among senior business executives who were trying to identify why people were likely to do business with you.

Morgan and Hunt realised that long-term business relationships are built on a mutual and cooperative working relationship between two partner firms. Focus on Trust and Commitment if you want to foster and nurture such relationships. That’s why we built these key metrics into the heart of our Customer Relationship Quality (CRQ) methodology.

Customer Relationship Quality (CRQ)

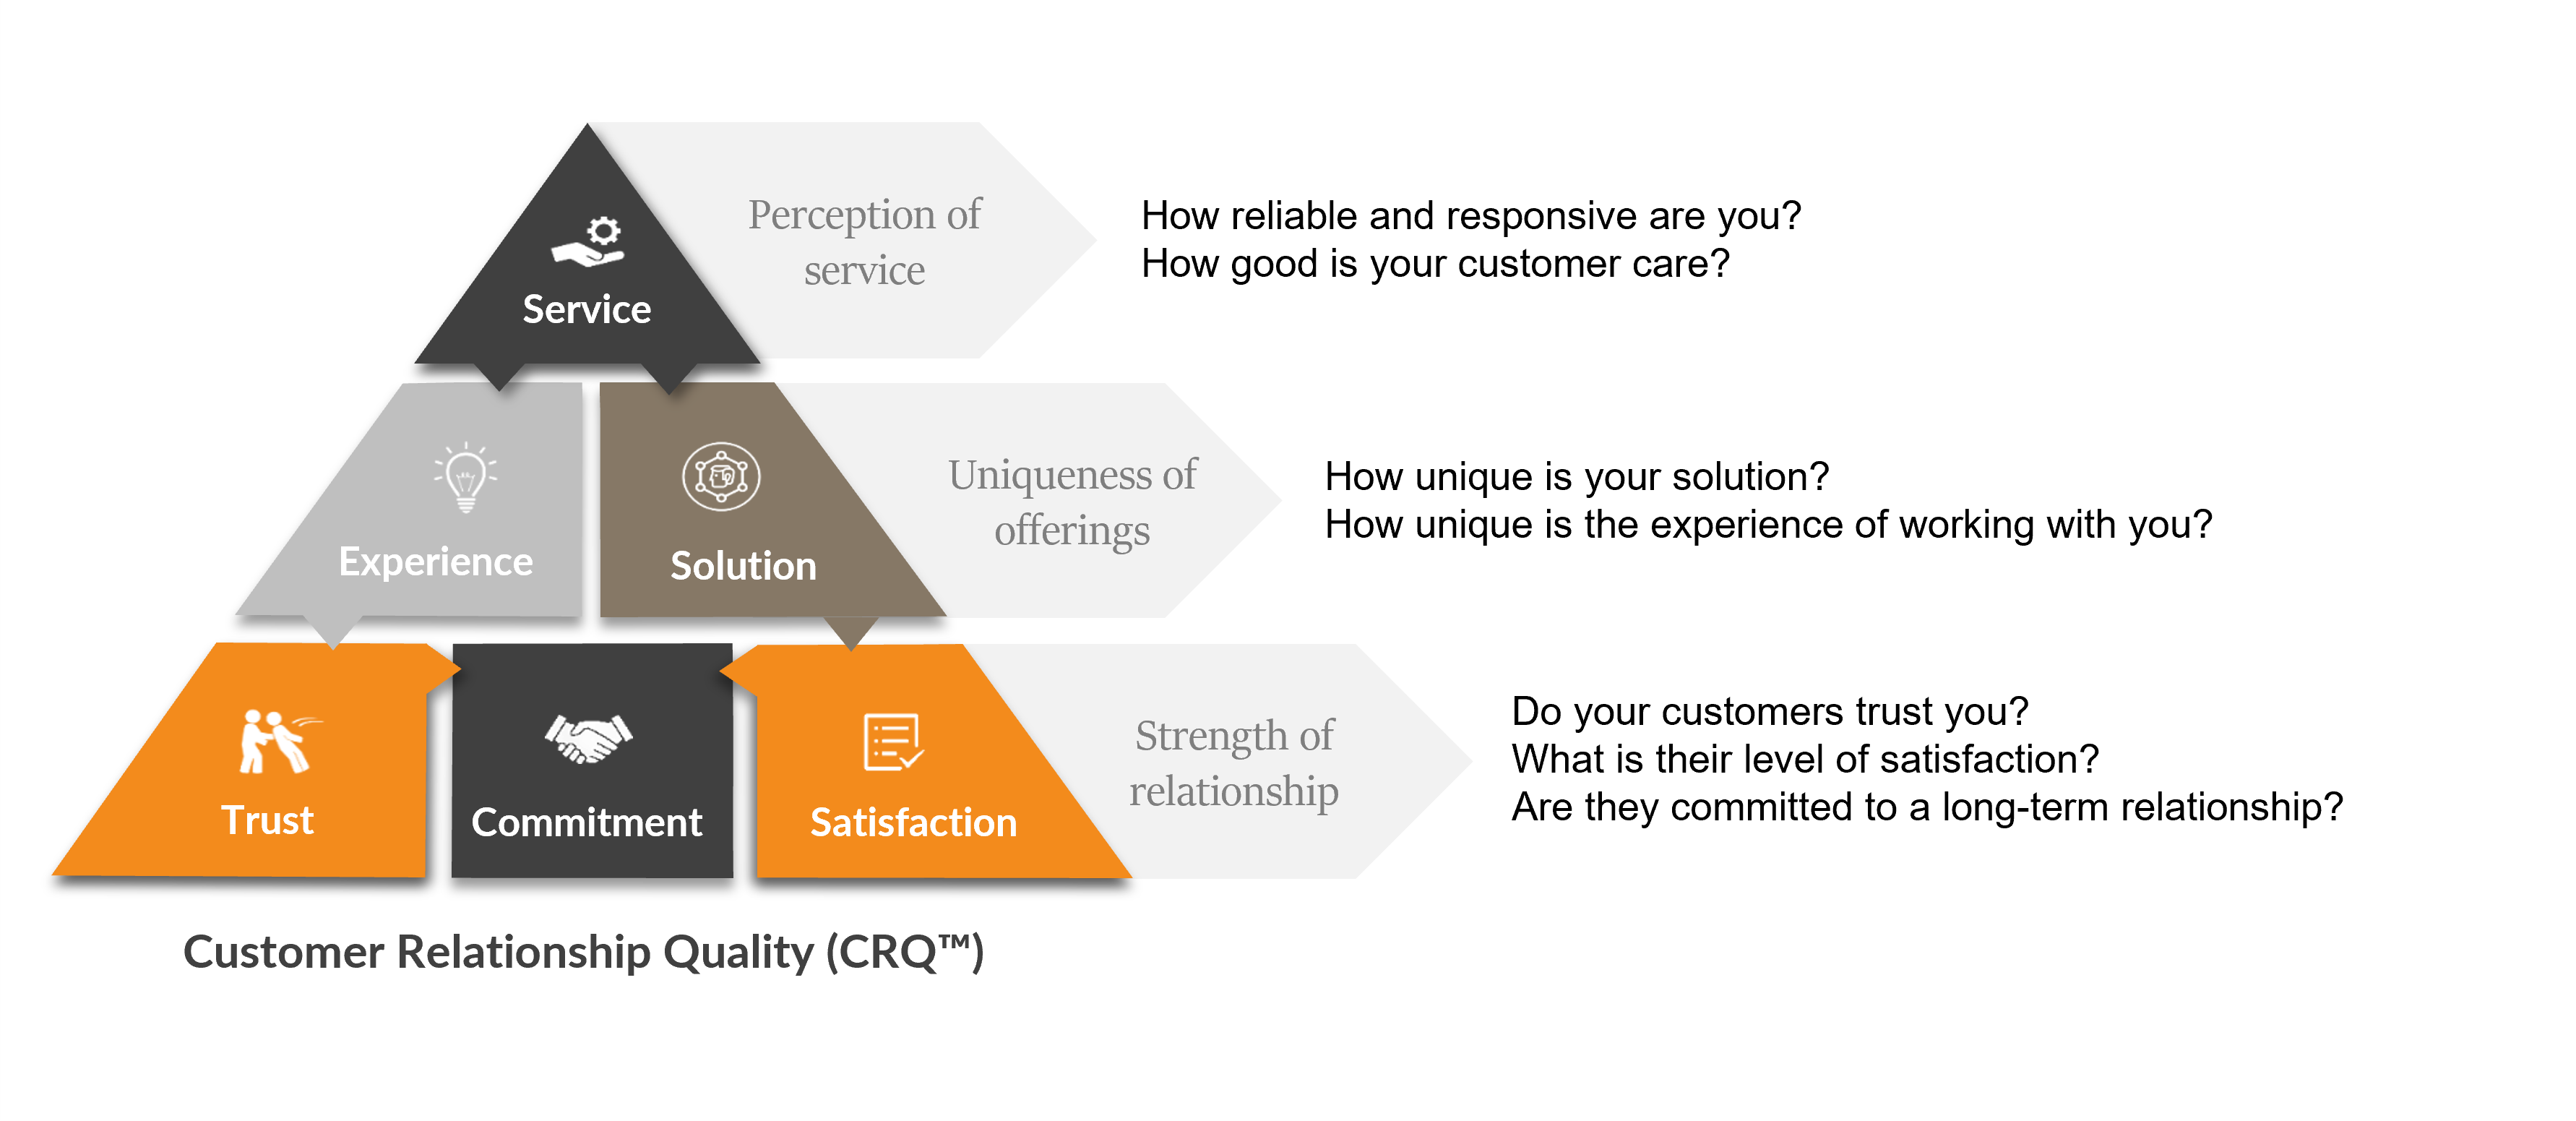
Deep-Insight’s CRQ model works on three levels. Let’s take a quick look at each level. From the bottom up:

The Relationship Level

Trust and Commitment are the most important building blocks for a good relationship but don’t ignore Satisfaction. This is simply a measure of whether the customer’s expectations have been met or exceeded. Satisfaction is quite transactional. Customers can be happy one day and deeply unhappy the next, if they experience a problem. If the problem is solved, satisfaction levels increase quickly.

The Uniqueness Level

Experience is a measure of how easy you are to do business with and if you are seen as a trusted partner. You can have the best products or services in the world but if your clients can’t work with you and don’t see your people as trusted partners, you will not be seen as ‘Unique’. Deep-Insight defines Solution as a combination of Innovation, Leading Edge and Value-For-Money. These are three related but slightly different concepts but if you score well on all three, you have an offering that can help your clients compete in the marketplace in a way that none of your competitors can do. When we talk about ‘Solution’ we’re not just talking ‘Product’. It’s as much about how the account managers, sales and delivery teams position your company’s product or service, as it is about the product or service itself.

The Service Level

Service covers three separate elements: Reliability, Responsiveness and Customer Care. Reliability measures whether or not you do what you say you do. Do you walk the talk? Do you do what you promise? Essentially, can your clients rely on you (and the ‘you’ refers to both the brand and the individuals working with the client). Responsiveness measures whether or not you react quickly to issues that arise. Better, still, are you proactive in anticipating customers’ needs or issues. Customer Care is all about making the customer feel valued.

Are you interested in building Trust and Commitment with your key clients? Would you like to find out more about our Customer Relationship Quality (CRQ) model? If the answer to either question is yes, contact us today.


Deep-Insight seen as ‘Unique’ in 2019 CRQ assessment

Our 2019 Customer Relationship Quality Results

A big Thank You to all of our clients and channel partners who completed our CRQ assessment this year! It provided us with a wealth of feedback. We are humbled that you have given us such positive scores and we are thrilled with both the overall results and the detailed responses that we received.

In summary: we had an overall completion rate of 49%, a CRQ score of 6.0 and a Net Promoter score of +53%. This is the strongest set of scores that we have ever received.
CRQ and NPS CRQ assessment

Regaining our Unique Status

Our scores this year mean that we are now back into ‘Unique’ territory, which we just missed out on last year. Uniqueness requires a combination of a winning ‘Solution’ and a great ‘Experience’. Last year, our ‘Solution’ scores had slipped and over the past 12 months we have been working hard to regain this ‘Unique’ status. It’s very gratifying to see all of our hard work paying off.

Unique Solution and Unique Experience CRQ assessment

Deep-Dive: New and Improved

We have reflected a bit on last year’s journey for Deep-Insight and why we regained our Unique status. As a result of your feedback last year, we took your comments on board and put together a plan to upgrade our Deep-Dive platform. As a result, we have recently rolled out Deep-Dive v1.1 which is faster, has more features and allows our clients to access individual account reports at a click of a button. The work that the development team put into Deep-Dive has paid off as we have seen our ‘Solution’ scores increase from 4.9 to 5.7 this year and we have already received some very positive feedback regarding our upgraded Deep-Dive platform.

Our Plans for 2019?

Even though we received an amazing set of scores this year and we are thrilled with the results, that does not mean we will take a break. We have put our heads together and came up with the following action points for the upcoming months.

No. 1 – Share Results with All Clients – and Create Joint Action PLans

We tell our clients to share their results with their customers as this is a very effective way of building strong relationships. In the past we have sometimes been guilty of not taking our own advice but this year we plan on doing exactly that with all of our clients. Expect us to reach out to you in the very near future so that we can review your feedback together and see how Deep-Insight can be more effective this year at helping you achieve your 2019 objectives.

No. 2 – More Support with Account Management 

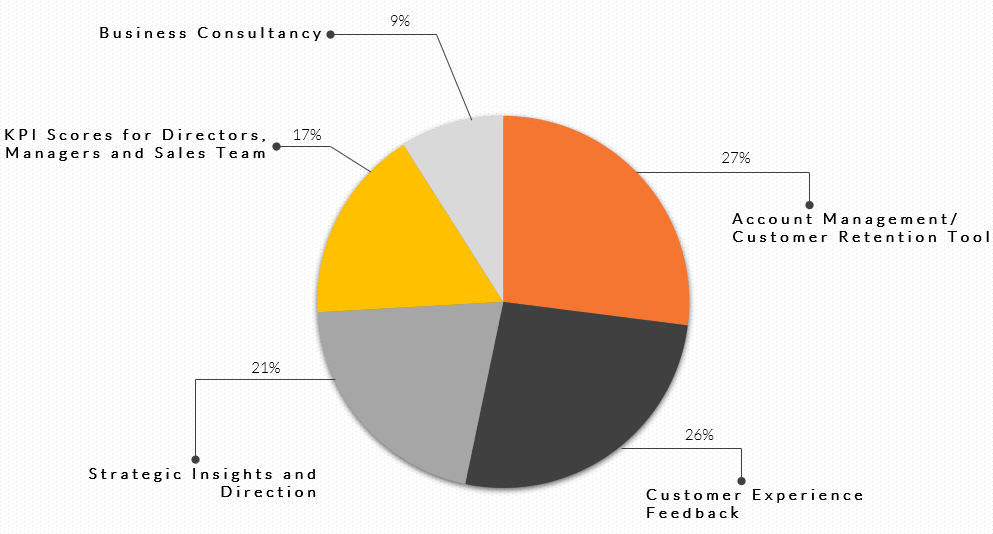
This year we asked you to what you use our services for. The answer? You use Deep-Insight and primarily as an Account Management/ Customer Retention tool, followed closely by Customer Experience feedback.

Customer Portfolio CRQ assessment
The message for us at Deep-Insight is that we need to spend more time with our clients at the start of any assessment to understand how you segment your client base, how you allocate account managers and service teams to those accounts, and how we can help you get more account-based insights from using the Deep-Dive platform. We also need to be more supportive in helping you use the results to manage those accounts more effectively. This is one area we would specifically like to explore with each of you in the coming weeks.

No. 3 – Aim for a Higher Response Rate in 2020

This is more of an internal action for us at Deep-Insight. A 49% response rate is not bad but we know that some of you set targets of 60% or higher, and you achieve them. We will be aiming for a 60% completion rate in 2020. We always advise our clients to work with their account teams to achieve the highest response rate possible, so for next year we will definitely put a stronger focus on this for ourselves as well.
Thank you again for your time and input into this year’s customer assessment. We will be in touch shortly.

John O’Connor

How to Maximise Completion Rates for a CX Programme?

Setting up and running B2B Customer Experience (CX) programmes is our ‘bread and butter’ at Deep-Insight.

We’re used to handling questions on how to make CX programmes more effective. One of the most common questions we get from first-time clients is: “What completion rates can I expect from my CX programme?” Another common question from longer-term clients is “How do I improve my completion rates?”

Let’s deal with each question in turn.
 

“What Completion Rates can I expect from my CX programme?”

Let me preface this by saying that we are talking about business-to-business (B2B) relationships so there is an inherent assumption in the question that our clients have some existing – and hopefully strong – relationships with their customers and that these contacts will be receptive to a request to give feedback as part of that ongoing relationship.

This is usually the case but clients – particularly senior clients – are busy people so it may not come as a surprise to hear that the average participation rate in a B2B customer assessment is around 35%.

But that 35% figure is an aggregate score and there’s a little more to it than that, if you have a look at the graph below.

completion rates CX Programme
 

The spread is wide.

The most common completion rate is in the 26-30% range. We have a smaller number of clients – typically those who have been running our Customer Relationship Quality (CRQ) assessments for many years – who regularly achieve completion rates of 50% and higher.

If this is your first time running a customer assessment – either a simple Net Promoter Score survey of something a little more complex like our CRQ relationship assessments – you can expect completion rates of less than 1 in 3.

This may sound OK if you regularly run consumer surveys where a 5% completion rate can be a good result, but for an existing long-standing B2B client relationship, it’s paltry. And yet we have been running customer assessments of all sorts for nearly 20 years and these are the actual numbers.

So now let’s get to the second question:
 

“How do I improve my completion rates?”

The starting point is to understand why some B2B companies sometimes get really low completion rates and others consistently exceed 50%.

Our lowest-ever completion rate (4%) came from a first-time UK software client. The quality of contact data was simply terrible. We should have spotted that it was little more than a ‘data dump’ from the company’s CRM system. The list included people who had left their companies three years earlier. It included people who had never even heard of our client. It probably included the names of people who were dead. That’s because there was no governance in place for the programme. The Sales Director was not involved. Account Managers did not personally sign off the client contact names. You get the picture.

Our highest-ever completion rate came from a company that has been a client of Deep-Insight’s for 10 years and whose customers view the annual CRQ assessment as a critical part of their ongoing strategic partnership.

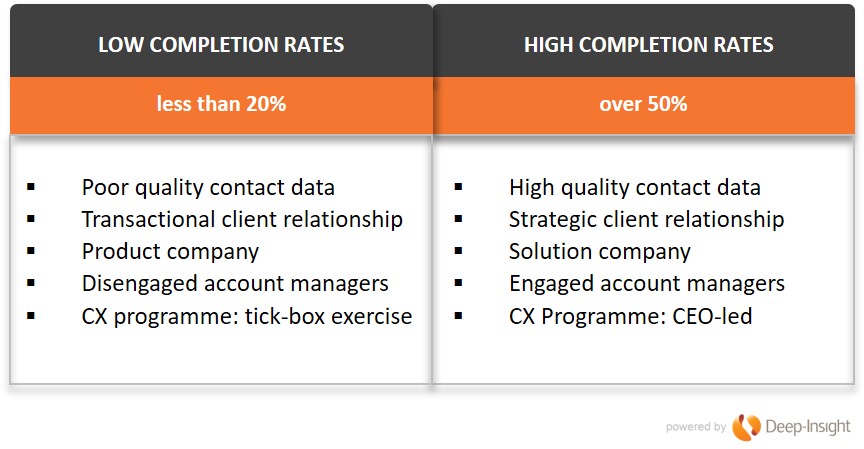
But there are other reasons for low and high participation rates. Here’s a quick summary of the profiles of our clients that fit into both categories:

completion rates CX Programme
 

6 Steps to Improve your Completion Rates

Here are the steps you need to take to get your completion rates up:

  1. Make It Strategic. If the CX programme is CEO-led and driven from the top, it will not be seen as another box-ticking exercise. Make sure this is a key item on the Executive agenda.
  2. Put in Governance Structures. By this we mean things like: a) Account Directors should supervise and sign all contact names, not just pull them from the CRM system; b) the Sales Director should personally sign off all Strategic Client contact names.
  3. Don’t call it a Survey! At Deep-Insight, we ban the use of the term “survey” . For us, a CRQ assessment is a strategic ongoing conversation with the clients and their views will be taken seriously.
  4. “Warm Up” the Contacts. An invitation to complete a survey should not come out of the blue. Ideally, it should be introduced by letter or by email by the CEO or Country Manager, and while an assessment is “live”, the account manager will know to stay in touch with the client and urge them to complete the assessment.
  5. Close the Loop. This is critical. If you ask for feedback, you need to share that feedback with the client, agree the actions that BOTH PARTIES will take to improve the relationship.
  6. Repeat. Get into a rhythm where your clients and your sales/account teams know that every February or October (or whenever), the annual strategic assessment will take place. You may want to run frequent assessments. Some companies have quarterly Net Promoter or Pulse assessments – but don’t overdo the frequency. Your organisation needs time to put remedial actions into effect.


Completion Rates of 90% or more?

Follow the above steps and you’ll get your completion rates to 50% or higher.

But remember that these completion rates are at an individual level. You should be getting feedback from multiple people at different levels within each client. Include Influencers and Operational Contacts as well as Key Decision Makers. That way you’ll get a wealth of information about what your key accounts REALLY think of you.

You’ll also get completion rates of 90% at an account level if you take this approach.

If you are interested in reading more about running a CX programme effectively take a look at our process for running a B2B CX assessment or just get in touch with us today for a chat.


Does NPS Work for B2B Companies
 

Why B2B Benchmarking is NOT a good idea!

Am I better than the competition?

If I got a penny for every time a client has asked “How do we compare against our competitors?” or “How are we doing against the benchmark for our industry?” I’d be a rich man. But the thing is that B2B benchmarking is not a good idea.

Seriously. You should strive to be a ‘Unique’ company and not an average company.

Most of our clients want to know how they are doing against the benchmark score for their industry. My response: “If you really aspire to being a mediocre company, then I’ll tell you what the average score is for your industry and how you compare against the average. But you can do better than that. You can be UNIQUE.”

In fairness, some of our clients have latched on to the message that they should ignore the competition. They should focus purely on being indispensable to their existing customers. Still, it’s tempting to see where you stand in a league tables against your industry peers.

So let me ask a few questions about why you want to do benchmarking. Because B2B benchmarking is not a good idea!

What exactly is your industry?

Are you in the insurance industry, or the insurance broking industry? Or are you in both? Or re you an outsourcing company that specialises in insurance third-party processing?

They’re all in the insurance world but these are very different industries. They have different dynamics and there are differences in average scores from one industry to the next. For example, we know from experience that many IT and most BPO (Business Process Outsourcing) companies tend to get lower than average scores, while corporate banking and professional services companies tend to get higher than average scores. Firms operating in niche markets also find it easier to be seen as different and unique.

If I say you’re at the industry benchmark, will you really be happy?

If you aspire to hit the average score for your industry, or your country, you’re setting the bar pretty low. What you’re telling me is that you want to be an average company.

To take my point to its extreme, benchmarking is little more than a recipe for mediocrity.

Do you realise that international benchmarks are inherently flawed?

This is not just because the insurance broking or widget-manufacturing markets in the Netherlands have a completely different structure than they do in Australia. It’s also because Dutch and Australian clients have completely different approaches to the way they answer customer surveys.

There are some good academic papers on how different nationalities are pre-disposed to answering questionnaires differently. Let me give just one example. Some people will claim that the average Net Promoter Score (NPS) for B2B companies is between 25% and 30%, regardless of industry. However, these figures are heavily skewed towards US companies.

Our experience of gathering NPS scores across 86 different countries since 2006 is that the average NPS score for any B2B industry is closer to 10%. But then again, our clients are more heavily weighted towards European and Australian respondents, who generally tend to score less positively than their American counterparts.

But I still want to benchmark my performance!

I thought you might say that.

If you really do want to benchmark yourself, then let me suggest that you approach the subject of benchmarking in a slightly different fashion:

  1. START BY SETTING THE BAR HIGHER. Aspire to be the best, or at the very least to be ‘Unique’ in the eyes of your customers. Our database at Deep-Insight shows that only 10% of B2B companies are considered Unique by their clients, but these Unique companies have significantly stronger relationships – and retention rates – than the ‘average’ company. Unique companies typically have twice the number of Ambassadors and have NPS scores of 30% or more.
  1. BENCHMARK YOURSELF AGAINST YOUR OWN PERFORMANCE LAST YEAR. That’s a much more reliable way of seeing if you are becoming more customer-centric or not. The journey to becoming a customer-centric organisation is a long one – don’t think you’re going to achieve it in anything less than three years – so be sure to check your progress formally on at least an annual basis.
  1. BENCHMARK YOURSELF INTERNALLY. See what your clients think of you, compared to the scores that are achieved by other divisions or business lines within the same company. If you’re an international company, benchmark yourself against other geographies (but watch out for the cultural differences between, say, American and European divisions.)

Remember that B2B benchmarking is not a good idea. It’s not a BAD idea. It’s just that you should ignore the competition and become unique for your customers.

Good luck!

Satisfaction or ‘Statisfaction’?

One of my esteemed colleagues recently sent a draft document to me that had a typo – satisfaction had been spelt with an extra ‘t’, making up a new word ‘statisfaction’.

That got me thinking!

I have been involved in numerous movements and initiatives to drive customer-focused business improvement for over 25 years – from Total Quality & Customer Satisfaction (CSat) through to Net Promoter Score (NPS) and Customer Relationship Quality (CRQ).

One thing that I have learned working with hundreds of companies across the world is that:

IT’S NOT ABOUT THE SCORE – IT’S ABOUT THE CUSTOMERS

Businesses like things quantified (there’s a perception that companies are run by accountants nowadays?), and on the whole I go along with the “what gets measured gets managed” mantra (see below), so I fully endorse customer experience and internal capability measurement.

I also like statistics! I’m intrigued by the fact that (as happened recently in a client) the average score of the Net Promoter question can go up but the NPS itself goes down! I love exploring how ‘the same’ internal capability score can be made up of completely different profiles of strength, weakness, consistency and impact across the organisation.

The first trouble with ‘the numbers’ (scores, averages, top-box, etc.) is that they DE-HUMANISE their source – our customers and how we manage their experience and value.

Yes, verbatims that are often included in the appendices of research reports and are summarised into frequency graphs of positive & negative sentiment (quantification again!), but I really wonder how many executives actually read every customer comment?

My point here is that customers are on a JOURNEY, and have a STORY to tell, but organisationally we’re only interested in a number.

My second problem with ‘the numbers’ is that hitting the score target can easily become the objective in itself rather than improving organisational capabilities. I have seen this lead to many counter-cultural, and indeed downright destructive, behaviours:

-Deselection of unhappy or difficult customers from surveys

-Writing new strategies instead of implementing the one you’ve got

-NPS begging – “please give me a 9 or 10 or I’ll get fired”

-Only ever addressing ‘quick wins’ – never the underlying systemic issues

-Blaming sample sizes and methodologies as an excuse for inactivity

-Blatant attempts to fix the scores (e.g. fabricated questionnaire completions, ‘evidence’ of capability that is in fact just a Powerpoint slide)

-Corporate tolerance of low-scorers – many companies seem content with the fact that large proportions of their customers hate them!

-Putting metrics into performance scorecards but with such a low weighting (vs. sales) that nobody really cares

-Improving “the process” instead of “the journey”

-No follow-up at a personal level because of research anonymity; or inconsistent follow-up if anonymity is waived – often only of low scorers treated as complainants – what about thanking those who compliment and asking for referrals from advocates?

I could go on, but I hope the point is made – beware of “what gets measured gets managed” becoming:

“WHAT GETS MEASURED GETS MANIPULATED”

So instead of targeting statistical scores, seek to find ways of improving your systemic capabilities to cost-effectively manage your customer experience – and then listen to what they’re saying to you about how satisfying it is.

By the way, your scores will improve too!


Peter Lavers is Deep-Insight’s UK MD. If you’d like to find out more about how NPS overcomes these issues, please contact Peter here.