It’s Hard to Please Europeans

It’s Hard to Please Europeans

Back to one of my pet topics: What is a ‘Good’ Net Promoter Score? 

More specifically, what’s a good Net Promoter Score score for a sports team? OK, I know NPS wasn’t designed as a sporting metric but bear with me as I try to illustrate a point about how Net Promoter Score works and how NPS scores are almost always significantly lower than most people think they should be.

I first looked at NPS for sports teams way back in 2020. That year, Liverpool won the Premiership for the first and only time and did so with a Net Promoter Score of -45, based on the player ratings of the Liverpool team.

To illustrate the point this time, let’s look at the performances of two great rugby teams that battled it out in their opening match of the 2025 Six Nations rugby tournament at Dublin’s Aviva Stadium last weekend: England and Ireland.

The Irish were favourites to win. It was a home game for the 2023 and 2024 Six Nations champions, who are currently ranked #2 in the world behind South Africa. England are ranked #7 in the world – a placing they were desperate to improve upon after a poor run of form in recent years.


How did England score in NPS terms?

Based on last weekend’s performance, Steve Borthwick’s England team has a Net Promoter Score of -60

That’s not my view. It’s based on the player ratings for the starting 15, as compiled by The Guardian’s Luke McLaughlin following their 27-22 defeat to Ireland.

Now here’s the thing. Luke is not being particularly harsh. Most English – or European – sports commentators adopt a similar approach to rating player performances. 

It’s not that England were dreadful last weekend. They come strongly out of the starting blocks. Cadan Murley scored the opening try on his debut after only 10 minutes. The Irish struggled to keep England at bay and England led by 10 points to Ireland’s five at half time.

The second half was a different affair, with some commentators claiming it was one of the best 40 minutes that Ireland had played in many a year. The game was over as a contest well before the final whistle was blown. Ireland were 27-10 ahead with five minutes to go. Then England scored a couple of late tries to put a more respectable gloss on the scoreline.  
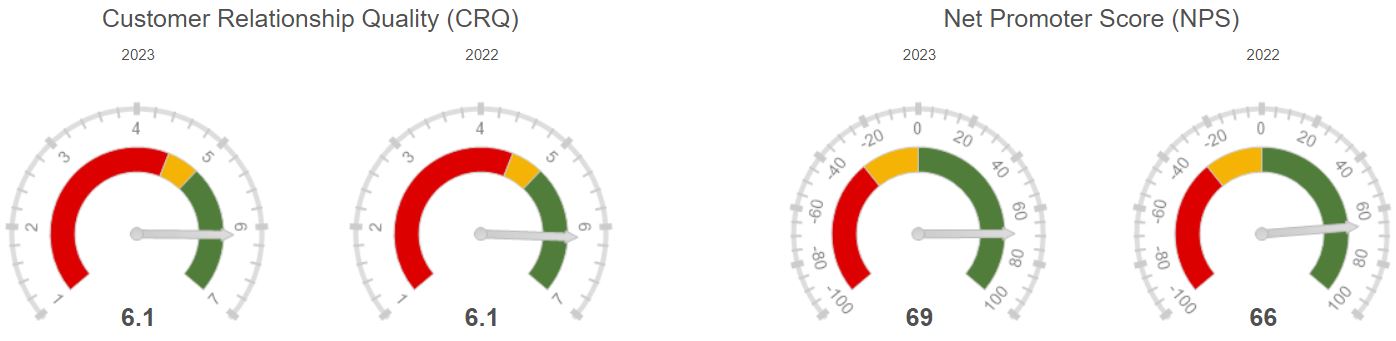
NET PROMOTER SCORE

A quick recap on the NPS scoring system: Scores range from 0 to 10. 9s and 10s are Promoters. 7s and 8s are Passives. 6s and below are Detractors. The Net Promoter Score itself is the percentage of Promoters minus the percentage of Detractors. It ranges from -100 (all Detractors) to +100 (all Promoters).

Have a look at Luke McLaughlin’s player scores for England’s starting 15 in the Box below. 0% Promoters; 40% Passives; 60% Detractors. That’s how England’s -60 NPS result is calculated: 0% – 60% = -60.

The highest-scoring English players were Ollie Lawrence and Tom Curry. Both scored 8/10. In Net Promoter Score terms, not a single English player got into ‘Promoter’ territory. But that’s not how Luke’s player summaries read. He’s actually quite praiseworthy towards many of them. It’s just how us Europeans score. It’s a cultural thing.

ENGLAND PLAYER RATINGS

Freddie Steward Solid but unthreatening. He won some important aerial battles, but England’s lack of attacking spark was notable. 6

Tommy Freeman Crossed for a late try to earn a losing bonus point. Did his best with little service: England’s attack never consistently fired. 6

Ollie Lawrence Muscular carry led to the opening score and always looked a threat – extremely strong on both sides of the ball. 8

Henry Slade Classy touches all over the place in first half. Exquisite grubber to create early try for Murley a reminder of his enduring ability. 7

Cadan Murley Quickly snaffled a try on debut, but later invited pressure on teammates twice with a serious lack of composure in defence. 5

Marcus Smith Bright and breezy as usual, but not always as effective as he needs to be. Does he maximise the talents of his backline? 6

Alex Mitchell Decent kicking from hand, but fell off a tackle against James Lowe after England had worked so hard to keep the hosts out. 6

Ellis Genge Played a part in a big forward effort. Carried with purpose and added weight in defence but gave away key scrum penalty. 6

Luke Cowan-Dickie Another England forward who performed admirably in the first half, but the pack collectively ran out of steam after the break. 6

Will Stuart Unspectacular around the field but did his bit defensively and performed his scrummaging duties competently. 6

Maro Itoje Communicated well with the referee, at least early on, and brought his usual physicality but his influence waned. 6

George Martin Mostly invisible but only because he was mostly doing the dirty work where it counted. Another quality day’s graft. 7

Tom Curry Sensational turnovers seemed to justify Steve Borthwick’s back-row plans. Rarely gave his opponents time to settle. 8

Ben Curry Just like his brother, did not deserve to end up on the losing side. Hurried Ireland up at the breakdown but limited in attack. 7

Ben Earl A quality display overall. Punishing in attack and defence, ran a perfect line to capitalise on a fizzing pass from Smith. 7


The Irish performance: NPS = +7

It was an epic victory for Ireland and that second half performance was sublime. Tries from Bundee Aki, Tadhg Beirne and Dan Sheehan put the game out of England’s reach well before the end. So what was Ireland’s Net Promoter Score? Remember the maximum score is +100 so surely Ireland’s performance deserved a score of +50 or higher?

Actually, Ireland‘s NPS was a mere +7 out of 100.

So how can that be? How does a team that blew away the English in the second half only manage to get a net promoter score that’s only slightly above zero.

The answer is pretty simple. Net Promoter is an American scoring system that rates advocacy on a 0 to 10 scale and only recognises scores of 9 or 10 as excellent. Americans tend to score more positively than Europeans. Europeans – particularly northern Europeans –  are particularly tough in the way they score. 9s and 10s are generally reserved for extra-special performances.

As I said, it’s a cultural thing.

Look at the player performance ratings below. Only one player, James Lowe, scored 9 out of 10 and he was the Man Of The Match according to Luke McLaughlin. Everybody else on the Irish team scored 7 or 8. In other words, 14 of Ireland’s 15 players are ‘Passives’. Their scores don’t count in the NPS calculation. No player was rated 6 or below so zero ‘Detractors’ in the Irish team.

Overall Irish NPS = 7% – 0% = +7.

IRISH PLAYER RATINGS

Hugo Keenan Exceptional covering tackle on Tommy Freeman in the first half, and joined in the attack with intelligent support lines as usual. 8

Mack Hansen Big hit on Cadan Murley in the opening seconds was impressive and he bounced back well from an early injury. 7

Garry Ringrose Kept a little quiet overall by the dynamism of England’s defence but as always a key cog in the champions’ machine. 7

Bundee Aki Quiet by his standards until a fantastic second-half finish after being fed by Prendergast, crashing past three defenders. 8

James Lowe Rock solid under an early high ball. Muscled through Mitchell to create hosts’ first try and also created key score for Beirne. 9 (man of the match)

Sam Prendergast A mixed bag. Endured a difficult first quarter but grew into the game. Missed conversions looked like they might be costly. 7

Jamison Gibson-Park A model of consistency – popped up on Lowe’s shoulder to get Ireland off the mark and typically effective elsewhere. 8

Andrew Porter Scrummaged well and is always an intimidating physical presence in the loose. Played his part in the second-half surge. 8

Rónan Kelleher Lineout functioned smoothly despite some recent concerns about the Irish set piece. Snuck over for a disallowed try. 8

Finlay Bealham Competed well in the scrum, winning a penalty from Ellis Genge, and contributed to the attack with his usual quality. 7

James Ryan The lineout went well and like the rest of the pack it was largely a different, better story for the lock after half-time. 7

Tadhg Beirne Cynical holding of Maro Itoje at a ruck led to a disallowed score. Always a massive presence and took his late try with aplomb. 8

Ryan Baird One strong carry in the first half that led to Marcus Smith’s yellow card. Grew into the match after the break like the others. 7

Josh van der Flier Slick hands, strong carrying and crushing defence. The back row is one of Ireland’s most consistent performers. 8

Caelan Doris Perhaps upstaged by the Curry twins in the early part of the game but grew into it along with the rest of his teammates. 7


The average B2B Net Promoter Score in Europe is not much above zero

Let’s get back to my main point here.

Many B2B companies claim very high Net Promoter Scores. +50. Maybe +70. Maybe higher. The reality is quite different. We have been measuring NPS for B2B companies for over 20 years and based on our database of results, we can confidentially say that an average NPS result for a Northern European B2B company is barely above zero.

Close to half of all European B2B companies will have negative NPS scores. Rarely will they score greater than +50. That’s a truly exceptional performance.

So if you’re about to measure your NPS performance in 2025, don’t set your expectations too high. And don’t believe everything you read on the Internet!


UPDATE (9 FEB 2025): Ireland score another 7 NPS points against Scotland

Week 2 of the Six Nations championship saw Ireland travel to Murrayfield in Scotland, while England hosted France at Twickenham.

The Irish stormed to a 32-18 victory after Scotland lost a couple of players early on (including their mercurial captain Finn Russell) following a nasty clash of heads. The English stormed back to a rousing 26-25 victory over Les Bleus with a last-minute try in what was an extraordinary match.

The NPS scores told a different story.

Ireland repeated its +7 performance when Jamison Gibson-Park received a 9/10 player rating from Johnny Watterson at the Irish Times. (The Guardian failed to provide ratings for me to share!). Every other Irish player was rated 7/10 or 8/10 and as we now know, ‘Passive’ scores don’t count in the net promoter score calculation. One ‘Promoter’ of of 15 = 7% hence the +7 NPS score for Ireland.

Gerard Meagher from the Guardian did provide player ratings for both England and France. England had three ‘Detractors’ (Marcus Smith, Luke Cowan-Dickie and George Martin), nine ‘Passives’ and three ‘Promoters’ (Fin Smith, Tom Curry and Ben Earl all received 9/10 player ratings) so the overall England NPS score was exactly zero, as the number of ‘Promoters’ equalled the number of ‘Detractors’.

The French, on the other hand, ended up with a -80 NPS performance. 12 out of the starting 15 received player ratings of 6/10 or less (‘Detractors’) and there were three ‘Passives’ and zero ‘Promoters’. Even the dazzling Louis Bielle-Biarrey could only manage a 7/10 player rating.  With 80% of the team identified as ‘Detractors’ and zero ‘Promoters’, France’s NPS score was -80.

Europeans are genuinely very hard to please!

Avoiding the CX Rat Trap

Avoiding the CX Rat Trap

Goodhart's Law


A story of rats, cobras and economists

This is a story about rats, cobras and economists (and no, they’re not the same thing!) but it’s primarily a blog about a British economist called Charles Goodhart and his take on target setting, key performance indicators (KPIs) and the law of unintended consequences.

Goodhart is a man whose musings are worth reading if you’re struggling to make your customer experience (CX) programme work. All CX programmes involve the measurement of customer satisfaction (CSat), Net Promoter Score (NPS) or similar KPI. Companies will sometimes incentivise their employees to achieve a particular CX objective: “If we hit our NPS target of +50 this year, all sales staff get an additional bonus of £1,000.” This is not an uncommon practice. It’s also not a good one, as we are going to find out shortly.

Charles Goodhart is best known for Goodhart’s Law, which is neatly summarised in the Sketchplanations cartoon above. Setting targets can result in unintended consequences, particularly where incentives are involved.

Before we delve into Goodhart and his famous law, let’s start with a couple of stories about rats and cobras.

The Great Hanoi Rat Hunt

In 1902, the French ruled Indochina, a region in South East Asia comprised of modern-day Cambodia, Laos and Vietnam. The capital and administrative centre was Hanoi.

That year, the French administrators introduced a bounty on rats after it was discovered that rats played a significant role in transmitting the plague. The Third Plague Pandemic was a pretty serious issue in Asia at the time. It had spread from China in the late nineteenth century and by the time it was finally eradicated in the 1960s, more than 10 million people had died from the plague.

A bounty seemed to make sense. To claim it, the locals simply had to bring in a bag of rat tails. There was no need for piles of dead rats clogging up the corridors of power in Hanoi – tails would suffice. Within weeks, the bounty was working. Hundreds of rat tails poured in. Then thousands. It seemed too good to be true, and so it turned out to be.

It didn’t take long for French officials to figure out what was happening. The bounty had created an entirely new industry in Hanoi where rodent tails were brought into the capital from the countryside. Worse still, entrepreneurs in Hanoi started to breed rats in order to increase their bounty revenues. The number of rats in Hanoi was increasing, rather than decreasing.

Eventually, the bounty was discontinued. This story of administrative failure and unintended consequences is told in Michael Vann’s book The Great Hanoi Rat Hunt.


The Cobra Effect

It’s not just the French who were outwitted by their colonial subjects. A similar case happened under British rule in India, and documented in Horst Siebert’s book Der Kobra-Effekt.

At the same time that the French were grappling with a rat epidemic in Hanoi, the British were dealing with a cobra explosion in India. Cobras were viewed by the British administrators as deadly pests and a bounty was introduced in Delhi for every dead cobra handed in to the authorities. Many cobras were killed and handed in but, to the bemusement of the British rulers, the cobra population seemed to be on the rise.

It’s the same story of simple economics: the cost of breeding a cobra was significantly lower than the bounty, so entrepreneurs started to breed cobras. When the bounty was stopped, the breeders released the remaining cobras into the wild, further exacerbating the situation.


Goodhart's Law

Charles Goodhart is a British economist. He was born in 1936 and spent nearly 20 years of his career at the Bank of England, working on and writing about public and financial policy. In 1975, he wrote a paper containing the line: “whenever a government seeks to rely on a previously observed statistical regularity for control purposes, that regularity will collapse.”

The comment was specifically about monetary policy but would later be generalised as a law about targets, metrics and key performance indicators (KPIs). In 1997, the anthropologist Marilyn Strathern expressed Goodhart’s Law as follows when she was investigating grade inflation in university examinations:

When a measure becomes a target, it ceases to be a good measure. The more a 2.1 examination performance becomes an expectation, the poorer it becomes as a discriminator of individual performances. Targets that seem measurable become enticing tools for improvement.

Marilyn Strathern’s interpretation that has become the most widely used today.

When a measure becomes a target, it ceases to be a good measure

The basic message from Goodhart’s Law is a simple one: beware the law of unintended consequences when you set targets for people to achieve.

This is equally true when companies set targets in the field of customer experience (CX). If senior leadership teams incentivise their sales people and account managers to hit Net Promoter Score (NPS) targets, they will be achieved come hell or high water. In a previous blog, I outlined how CX programmes are often ‘gamed’ to achieve ridiculously high NPS targets which bear no relationship to the company’s actual performance. Common actions taken to game the CX system include:

  • Selecting only those clients who are Ambassadors for you and your product or service, when you are looking for customer feedback
  • Within those clients, selecting only those individuals who you know will score you 9/10 or 10/10 (these are ‘Promoters’ in NPS terminology)
  • Making sure to deselect any client that is likely to give you a poor score, using excuses like: “Now is not the right time to ask their views” or “We’ll only antagonise them if we approach them now”
  • Refusing to send a survey to anybody who doesn’t know you really well, even if it’s a senior decision maker that you’d love to have a conversation with. Why? The chances of them scoring you 9 or 10 are slim
  • Not outsourcing the NPS survey process to a third party that can give the option of confidentiality to survey participants – confidential surveys are likely to elicit lower scores even if they provide a much more realistic and honest view of your product or service

In many cases, employees and leadership teams are unaware that they are gaming the system. They simply believe that they are doing the right thing for the company.


Avoiding the CX Rat Trap - 5 Rules

Rule No. 1: Do not incentivise employees to achieve CX targets. It’s that simple. If you do, you’ll end up with more rats and cobras than you can handle.

Rule No. 2: If your Senior Leadership Team or Board is bonused on achieving NPS results, stop this practice immediately! You would be amazed at the number of companies that engage in such bonus schemes.

Rule No. 3: Resist the temptation to publish your Net Promoter Score in your annual report. All you are doing is setting yourself up for inflated NPS results as nobody in the organisation will want to be associated with a ‘down year’. It’s human nature. By accident or design, employees and leaders will game the system to achieve higher scores next year.

Rule No. 4: Put a robust CX governance structure in place. Make sure ALL clients are surveyed. Sign off the contact lists. Resist the urge to exclude people whose views might be unfavourable – you want to know what they are thinking.

Rule No. 5: Finally, don’t approach CX with the mindset of a colonial administrator! Senior leadership teams have to view customer feedback as a gift. They have to encourage their colleagues to be open about getting feedback, whether good, bad or indifferent. Without honest feedback, change will never happen. Poor practices will continue and eventually clients will leave.

Finally, if you want to find out more about how to set up and run a customer experience (CX) programme effectively, contact us for a chat. We’d love to hear from you.

The B2B Blindspot: Why NPS Isn’t Enough

The B2B Blindspot: Why NPS Isn’t Enough


Why do so many B2B CX programmes fail?

Later this year, Bert Paesbrugghe will be hosting a LinkedIn webinar called The B2B Customer Success Blindspot: Why NPS Isn’t Enough. It sounds like it will be a good session and I have cheekily borrowed his title for this blog as it got me thinking about some of the reasons why B2B companies set up customer experience (CX) or Net Promoter Score (NPS) programmes in the first place.

More important, it’s worth reflecting on why these CX and NPS endeavours often fail to deliver on their initial promise. And that’s the sad truth – many of these programmes fail to improve the service delivered to customers. They don’t succeed for a variety of reasons. One of these is the belief that Net Promoter Score is a silver bullet for solving all manner of customer woes.

It’s not. That’s the blindspot. NPS is not enough for B2B companies.

B2B is different

The first thing to mention is that the Business-to-Business (B2B) world is VERY different to its Business-to-Consumer (B2C) counterpart.

The consumer world is all about the 4Ps: ProductPricePlace and PromotionMarketing guru Philip Kotler popularised the 4Ps back in the 1960s. They were a core part of his Marketing Management book that many of us still have on our shelves today.

My only real problem with the 4Ps model is that it’s essentially a B2C concept. It doesn’t cover the subtleties of the B2B world where very often a service provider is delivering a very complex service across multiple locations – often in different countries. This is a world away from selling and marketing consumer products such as Mars Bars or Mercedes cars.

The 4Ps also don’t take into account the need for key/ global account management or the associated challenges of building and maintaining relationships with multiple decision makers and influencers across large global organisations.


NPS is one-dimensional

Net Promoter Score has proven to be one of the most durable metrics in management, ever since its invention by academic and business consultant Fred Reichheld more that two decades ago. Reichheld’s basic premise was that you only need to ask one question in order to understand if a customer is going to stay loyal to you or not. The question is: “How likely are you to recommend us to a friend or colleague?”

Fred, an excellent marketeer, promoted the benefits of his Net Promoter Score (NPS) concept in publications like the Harvard Business Review. He then proclaimed its merits in his 2006 book The Ultimate Question. Since then, NPS has became a hugely popular metric for customer loyalty and customer experience.

I’ve written about NPS before and, in general, I’m a fan of the metric for both its simplicity and its popularity. Sure, it’s not perfect, as Professor Nick Lee points out. But then again, is there a perfect KPI for anything? Let’s agree that Net Promoter Score has its place and is worth measuring even if it is a little one-dimensional. 

So NPS is good, but much more is required, particularly in the B2B world with all of its complexities, peculiarities and challenges.


Why NPS is not enough (in B2B)

Let’s go back to basics here. B2B IS different. So let’s recap on what some of those differences are:

  • Customer Base. Consumer brands like Mars Bars and Mercedes cars are sold to millions of individuals. Three million sold every single day, in the case of Mars Bars. In contrast, we work with B2B clients that generate annual revenues of more than €1bn from fewer than 100 clients.
  • Value. A Mars Bar costs around €1.60 at the time of writing (let me know if you can source them cheaper!) while an outsourced IT contract can be worth €100m. Admittedly, a Mars Bar can be consumed in less than five minutes while a €100m contract might take five years to consume. But you get the picture: value and Value For Money are very different in the B2B and B2C worlds.
  • Marketing Strategy. We talked earlier about Kotler’s 4Ps. While the consumer world is all about Product, the B2B world is more around Service and Relationships. Even in today’s AI-enabled world, those services are still delivered by people. Relationship-building is a critical component of the marketing mix the B2B world.
  • Sales Focus. In the consumer world, merchandising and point-of-sale advertising are key. In the B2B world, far more emphasis is placed on educating the customer about features, benefits, return on investment, and so on. This is still mainly done through personal contact and relationships.
  • What to Maximise? The consumer world is about the transaction – promoting those Mars Bar at the point of sale, for example. Customer lifetime value (CLV) is rarely if ever mentioned in the consumer world. CLV is arguably the most important thing to maximise in the B2B world as it typically takes 2-5 years to recover the initial sales cost of a major multi-year contract win.
  • Buying Process. In a supermarket, buying a Mars Bar is a split-second decision. Even for a Mercedes, the decision can be quick. Clinching that 5-year outsourcing deal can and does take years from beginning to end. It also involves multiple decision-makers and influencers.
  • Buying Decision. In the consumer world, decisions are often made on emotion – hence the importance of brand and image. In the B2B world, we like to think decisions are made on rational grounds, based on cleary-defined evaluation criteria.


What else is needed?

Let’s assume we have just sold a 5-year outsourcing deal to a client and we are now in the onboarding or delivery stage of that contract. Yes, it’s useful to know if our client would recommend us to a friend or colleague. That’s the Net Promoter question, but is it enough?

Not really. Ideally, we need to know much more. For example, do our clients trust us now that we have started working for them? Are they committed to us for the long term? Are they happy with the service that they are now receiving? 

These are just some of the questions that we need to ask our B2B clients in a systematic way. We need answers at an aggregate level but we also need feedback at an account level. Contract A may be going swimmingly. Contract B may already be on the rocks (to continue the theme) but we might not know that if we are only getting aggregated client feedback.


Eliminating the blindspot: Customer Relationship Quality (CRQ)

An alternative to asking the one-dimensional NPS question is to view the customer relationship more holistically. That’s where Customer Relationship Quality (CRQ) fits in.

CRQ can be visualised as a pyramid comprised of three different levels.

  1. The first and most fundamental is the Relationship level. Do your clients trust you, are they committed to a long-term relationship with you, and are they satisfied with that relationship?
  2. The second is the Uniqueness level. Do your clients view the experience of working with you, and the solutions you offer, as truly differentiated and unique? Do they see us as good value for money?
  3. At the top of the pyramid is the Service level. Are you seen as reliable, responsive and caring? Get this wrong and you will never be seen as Unique and you will struggle to build a long-term relationship with that client.

Interestingly, CRQ and NPS scores are highly correlated. If you score well on all six elements of this Customer Relationship Quality (CRQ) model, your clients will act as Ambassadors, generating a high NPS result for you. However, CRQ gives you so much more information to act upon, and that’s far more important.


The most important part: Action

The CRQ model above was specifically designed for the B2B world. That said, it really doesn’t matter what questions you ask your clients if you fail to do anything with their feedback.

The most important part of any NPS, CRQ, CX or client listening programme is the ‘Action’ piece. The reason that many  customer programmes fail to deliver is that they are run by the Marketing department (sorry guys and gals!) while the members of the company’s Senior Management Team have collectively washed their hands of any responsibility for acting on that client feedback.

In most B2B organisations, key client relationships are owned by Sales. In some cases where delivery is an ongoing function, it’s the Service or Operations functions that have most of the day-to-day client contact. It’s rarely, if ever, somebody from Marketing. The Sales Director (or Service/ Operations Director) needs to own the ‘Close The Loop’ element of the programme. It’s unfair to expect Marketing to take responsibility for it.

Put it another way: it’s madness to think that Marketing can effect change on its own. That’s a Leadership function. I’ve never seen a successful NPS ar CX programme that has not been driven from the top. So regardless of what you think of NPS as a B2B metric, don’t assume that NPS or any other set of survey questions is going to improve your top line or your profitability. It won’t, unless there’s follow-up action. That action needs to be managed systematically, and it needs to be driven by the  SMT or Executive Team.

Finally, do remember that it’s not about the score. It’s about using that valuable client feedback to take action and become more customer-centric. That’s how you generate more revenues and boost profits.

We have a fantastic NPS score, again! – but its not the full story

We have a fantastic NPS score, again! – but its not the full story

Great News

We are genuinely delighted to announce that our NPS (Net Promoter Score) and CRQTM (Customer Relationship Quality) scores are fantastic, again! Stifle that yawn – I promise it gets more interesting. 

We are very proud of this picture. Most of our customers are promoters – they love our products and services and are willing to tell the world about it. Time to celebrate and shout this from the rafters – right?

Call it intuition or call it 20+ years’ experience in understanding client feedback but far more digging into the feedback would be needed before we were ready to celebrate.

The result of this digging is the creation of a new role – Product Manager – and their first objective will be to validate if we have the correct product strategy

So, how is this logical given the amazing feedback that I have just shared, especially around product? The answer to that is a lesson on why you should never just rely on NPS to tell you how your customers are feeling or what their future intentions might be.

Lets start digging.....

This is where CRQ really helps us to get under the bonnet of even the rosiest feedback, forcing us to listen to the murmurs of bubbling discontent.

The first red flag is when we asked all respondents what our greatest weakness is, not only did we have a new winner – we had a new topic entirely and it was mentioned by 15% of respondents.

Is this really a problem?

Immediately the internal arguments came that this was a blip and not that important. Arguments we used to try and convince ourselves were:

  • 15% is still not that many!
  • Price (often a key indicator of competitiveness) is not raised by even one respondent.
  • We are in the CX business for over 20 years (long before CX was even a thing) – you will find it difficult to find a competitor in the B2B space with more global, cross industry, experience than us.
  • Just look at that promoter graph again, our customers love us!

The only way to answer these arguments is to establish if there are further data insights that support this feedback? (Keep Digging)

We started by segmenting the feedback into the respondents who know us best – the CX Teams we work with every day and Key Decision Makers who repeatedly choose us as their CX Partner.

Turns out that even a higher percentage of the individuals who know us best believe this to be a weakness for us.

Further investigation of CRQ™ scores only compounded that we need to listen. Focusing again on those individuals who know us best, scores that link closely to this type verbatim have slipped from Top Decile Scores to Second Quartile Score .

The important Insight from all this data

🙂 Great overall scores are not wrong – Our customer love what we do and how we do it.

But here is what we cannot ignore

🙁 Our customers want more CX services than we currently offer, and they perceive that there are other suppliers in the CX space now who can give them what they want.

😐 Some of our customers also believe that other CX suppliers are better at promoting themselves in the market and raising brand awareness.

The exciting part of all of this

🙂 Our customers do not want to use those other suppliers; they trust us and believe in our integrity as their CX Partner. They want us to provide these additional services, and they want us to tell the world how great we are.

The Action - A new position in Deep-Insight: PRODUCT MANAGER

FIRST OBJECTIVE: Validate if our current product strategy is correct, needs to be tweaked or needs a massive overhaul. 

FIRST STEP: Ask many customers, previous customers, industry contacts and friends for your input and I will be extremely grateful to anyone who can give us the time to help

PURPOSE: Change, even if that is in a way that neither us nor our customers can predict just yet 

P.S. I am not ignoring the brand promotion and awareness feedback, our CEO John O’Connor is going to take personal ownership of addressing this. Watch this space, his thoughts will follow shortly.  

The Lionesses have a Net Promoter Score of -82

The Lionesses have a Net Promoter Score of -82

Lionesses

Back to one of my pet topics: What is a ‘Good’ Net Promoter Score? 

More specifically, what’s a good Net Promoter Score score for a football team? OK, I know NPS wasn’t designed as a footballing metric but bear with me as I try to illustrate a point about how Net Promoter Score works and how NPS scores are significantly lower than most people think.

Let’s have a look at two fabulous teams that battled it out in the 2023 Women’s World Cup Final in Sydney last Sunday: England and Spain.


How did the Lionesses score in NPS terms?

I first looked at NPS for football teams in 2020. That year Liverpool won the Premiership for the first and only time and did so with a Net Promoter Score of -45, based on the player ratings of the Liverpool team.

Based on their performance in the Women’s World Cup Final last weekend, England’s Lionesses have a Net Promoter Score of -82. If you include the three English substitutes, their NPS drops to -86.

That’s not my view. It’s based on the player ratings for the starting 11, as compiled by The Guardian’s Louise Taylor in the aftermath of their 1-0 defeat to Spain. And Louise Taylor is not being particularly harsh. Most English – or European – sports commentators adopt a similar approach to scoring. 

It’s not that England were poor last Sunday. They played well in the Final and had a great tournament. They were unfortunate to be matched against a Spanish team that was simply brilliant. Spain controlled the game superbly from beginning to end. Their passing was sublime. Olga Carmona’s goal was inch perfect. It had to be to beat Mary Earps.

By the way, Mary Queen of Stops was only rated 8, despite a penalty save late in the game. That’s a ‘Passive’ in Net Promoter terminology.

A quick recap on the scoring system: 9s and 10s are Promoters. 7s and 8s are Passives. 6 and below are Detractors. The Net Promoter Score itself is the percentage of of Promoters MINUS the percentage of Detractors.

Have a look at Louise Taylor’s player scores for the starting 11 below. 0% Promoters; 18% Passives (that’s two players: Earps and Hemp); 82% Detractors. That’s how the -82% NPS result is calculated. 0 – 82 = -82.

So did the Lionesses deserve a NPS of -82? Of course not. But at least the victorious Spanish team scored well in the NPS stakes. Or did they?

ENGLAND PLAYER RATINGS

Mary Earps. Mary Queen of Stops made vital saves from Paralluelo at the near post and Caldentey before denying Hermoso from the penalty spot. Had no hope of saving Carmona’s goal. Sometimes furious with her defence. 8

Jess Carter. Her great late block from Hermoso epitomised a fine tournament contribution. Coped well with second-half switch from right-sided central defender in a back three to left back and generally held her own. 6

Millie Bright. England’s captain advanced from central defence to join the attack in the closing stages. Sometimes struggled to cope with Paralluelo’s pace and movement but her decent positional play almost certainly kept the score down. 6

Alex Greenwood. Required a Terry Butcher-style head bandage after being caught by Paralleulo’s knee late in the second half. Showed flashes of her classy distribution but, for once, it was not enough from the elegant defender. 6

Lucy Bronze. Targeted by Spain and at fault in the preamble to Carmona’s opener, losing concentration and possession after taking one touch too many. A big mistake and too reckless at times. 4
Georgia Stanway. Did not see as much of the ball as she would have wanted and proved wasteful in possession but worked hard to help protect her defence. 5

Keira Walsh. Not at her best in the final – or the tournament – and still looks slightly uncomfortable in a midfield five. Struggled to retain possession. Conceded a handball penalty awarded after a lengthy VAR review. 4

Rachel Daly. Like Bronze, targeted by Spain and often pinned back by advances from Batlle, Bonmati and Redondo. Replaced by Chloe Kelly as England switched to a back four at half-time. 5

Ella Toone. Preferred to Lauren James in the starting XI but her poor positioning and slow reaction exacerbated Bronze’s error before Carmona’s opener. Replaced by Beth England in the 86th minute. 4

Alessia Russo. Worked as hard as ever but largely isolated as Spain dominated possession and was replaced by Lauren James at half-time. 5

Lauren Hemp. Reborn in a central attacking role, Hemp scared Spain, hitting the bar with an accomplished first-half shot. Should have scored after connection with a Kelly cross. Harshly booked. 7

Substitutes
Lauren James. Back for the second half after a two-match suspension but initially struggled to get on the ball before later growing into the game. 6
Chloe Kelly. Ran at Spain with menace and crossed brilliantly for Hemp but failed to supply sufficient killer final balls. 6
Bethany England. 6


The Spanish performance: NPS = +9 (or maybe -7)

As I said, the Spanish team performance in last Sunday’s Final was magnificent. So what was their Net Promoter Score? Surely it was +50 or higher?

Actually, Spain’s NPS was a paltry +9. If you include the three Spanish subs, its NPS was -7. Yes, that’s right – a negative NPS for the 2023 World Cup Winners.

How can that be?

The answer is pretty simple. Net Promoter is an American scoring system that rates advocacy on a 0 to 10 scale and only recognises scores of 9 or 10 as excellent. Americans tend to score more positively than Europeans. Northern Europeans are particularly tough in the way they score. 9s and 10s are generally reserved for extra-special performances.

It’s a culture thing.

Look at the player scores below. Only 2 Promoters in the Spanish side: the goal scorer Olga Carmona and midfielder Aitana Bonmati. That’s 18% of the starting 11. Subtract 9% for the one Detractor (Jennifer Hermoso, and no, she didn’t have a bad game). NPS = 18 – 9 = +9.

If the three substitutes are included, that an additional 7 (Passive) and two 6s (Detractors). Now the NPS score becomes 14% (2 Promoters out of 14 players) minus 21% (3 Detractors out of 14). 14 – 21 = -7.

SPAIN: PLAYER RATINGS

Cata Coll. Spain’s inexperienced goalkeeper saved smartly from Lauren Hemp early on and Lauren James late on. Well protected by her defence and not really threatened by England but did not put a foot wrong in only her fourth senior appearance. 7

Ona Batlle. Stretched England when advancing from right back and combined well with Aitana Bonmatí. Gave Rachel Daly quite a workout and defended extremely well too. 8

irene Paredes. Sent a first-half chance flying wide and repeatedly second-guessed England’s attacking intentions superbly. 8

Laia Codina. Defended well before limping off injured to be replaced by Ivana Andrés in the 73rd minute but, unsportingly, got Lauren Hemp booked. 7

Olga Carmona. Her third goal for Spain was a piece of left-footed technical perfection directed low into the bottom corner. It deserved to win a World Cup. Defended well, too. 9

Aitana Bonmatí. Brilliant and utterly irrepressible. Showed off a wonderful change of pace as she regularly fazed England. Fractionally off-target with fine second-half shot. Too hot for the Lionesses to handle. 9

Teresa Abelleira. Helped Spain hog possession and ensured that England’s increasingly midfield were left chasing shadows. 7

Jennifer Hermoso. Had a second-half penalty save but that was about the only moment nerves got the better of the midfielder. 6

Alba Redondo. An important outlet for Spain down the right. Her low crosses created some good chances but faded slightly in the second half and was replaced by Oihane Hernández after 59 minutes. 7

Mariona Caldentey. Saw a shot brilliantly saved by Mary Earps after nutmegging Lucy Bronze early in the second half. Replaced by two time Ballon d’Or winner Alexia Putellas after 89 minutes. 8

Salma Paralluelo. The 19-year-old Barcelona winger has been a star of the tournament and her quick, clever feet stretched England. Should have scored. Reminded England she was once a star 400m runner. Hit a post. Booked and very lucky not to receive a second yellow late on. 7

Substitutes
Oihane Hernández. The right-back arrived on the wing to help maintain Spain’s lead. 7
Ivana Andrés. 6
Alexia Putellas. 6


The average B2B Net Promoter Score in Europe is not much above zero

A couple of weeks ago, I wrote another blog called Things that never happened: a NPS of +91. Same topic; same message.

B2B companies may claim very high Net Promoter Scores but the reality is quite different. An average NPS result for a Northern European B2B company is only +3. Close to half of companies will have negative scores.

Rarely will European B2B companies score greater than +50. That’s a truly exceptional performance.

Don’t believe everything you read on the Internet!