If Trust is so important, why do so few companies measure it?

Most people understand implicitly that good Business to Business (B2B) relationships are built on a strong foundation of trust. But if Trust is so important, why do so few companies measure it? It’s a question that has always intrigued me. I must admit that I’m still struggling to find the answer.

The fact is that CEOs keep tabs on all sorts of KPIs. For operational performance, there are lots of service level agreements (SLAs) and other three letter acronyms (TLAs). Logistics companies even have five letter acronyms like DIFOT – Delivery In Full On Time. For financial performance, the CFO has an eye-watering array of metrics. For customer performance, there is customer satisfaction (CSat) and Net Promoter Score (NPS).

But rarely, if ever, is there a metric for Trust that is discussed by the leadership team or reported to shareholders.
 

How Important is Trust?

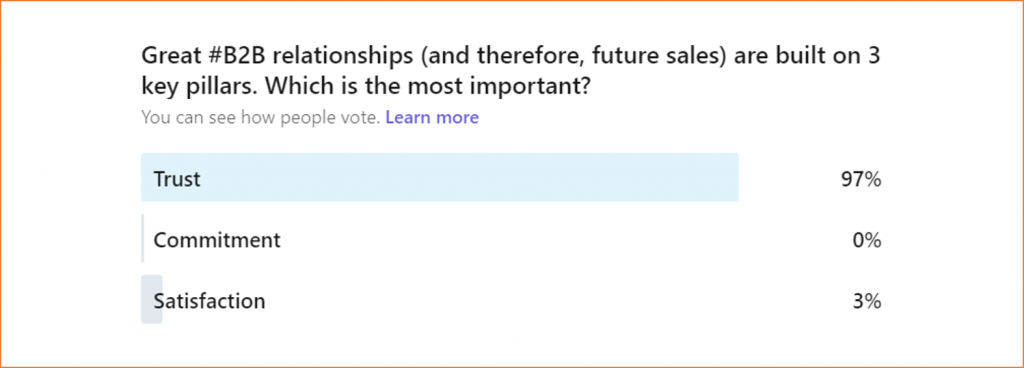
A couple of weeks ago, I ran a short poll on LinkedIn, asking people what they thought was the most important element of a strong B2B relationship. It wasn’t a trick question as we believe at Deep-Insight (based on pretty good academic research) that the three key pillars of a great B2B relationship are Trust, Commitment and Satisfaction.

I wasn’t surprised by the winner but I was intrigued by the margin. It appears that Trust really is seen as the cornerstone of a strong B2B relationship.

Trust Commitment Satisfaction
 

Trust, Commitment and Satisfaction

How are they all related? Here’s how we explain it.

If you take a purely commercial view of any business relationship – and you shouldn’t – it’s all about the revenues you can generate from that relationship over the long term. I know that’s a bit mercenary but that’s how some people view things. The greatest predictor of a long-term relationship is Commitment and it’s important that you measure your clients’ commitment to you. We ask that question quite bluntly to our clients’ customers: “Are you committed to a long-term relationship with [Name of Client]?”

It turns out that the answer to this question has the highest correlation with the likelihood of the company buying from our client again in the future. The opposite is also true. A poor score is the best predictor that the customer will defect to the competition.

But remember: commitment to a long-term relationship is only the outcome of other factors. Two of the most important factors are Trust and Satisfaction. Trust is all about fairness, honesty and acting with integrity. It’s a reflection on what clients think of your brand but, more important, it’s their perception of how trustworthy your people are as well.

Satisfaction, on the other hand, is a measure of how well you meet (or exceed) a client’s expectations. It’s more transactional than Trust, and also more volatile. For example, you can be satisfied with your IT service provider today, but deeply unhappy tomorrow when the network crashes and your factories or stores can’t operate. When the IT service provider pulls out all the stops and fixes the problem in double-quick time, you’re both relieved and satisfied again. Satisfaction scores can fluctuate wildly. Trust scores? Not so much.


Trust at Serco

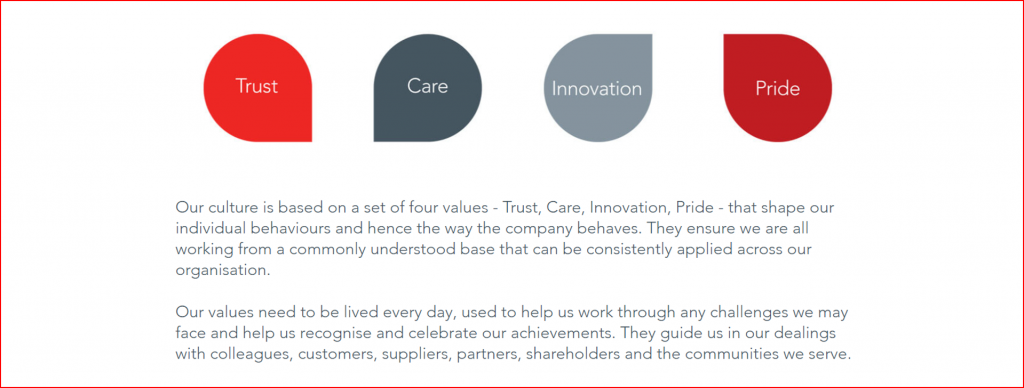
One of our clients that takes Trust seriously is Serco. It’s one of Serco’s four stated values: Trust, Care, Innovation and Pride.

Trust at Serco

Serco is quite clear about both what Trust is, and what it is not. Here are the behaviours it expects from its people:

  • Do what they say they will, try their best and see things through
  • Consistently provide the highest standards of customer service
  • Have a can-do, will-do attitude
  • Are open and honest
  • Communicate truthfully, clearly and concisely
  • Aim to always do the right thing and never compromise our values
  • Think through the consequences of their decisions
  • Speak out when they see something wrong
  • Understand who our customers are, listen to them and act upon their feedback
  • Challenge assumptions in an appropriate way
  • Acknowledge when they make mistakes and take responsibility for correcting them
  •  

    Similarly, Serco believes Trust is not demonstrated if employees or the leadership:

  • Make promises that we cannot keep
  • Rush to provide solutions before listening to others’ needs and opinions
  • Fail to keep customers and colleagues informed
  • Are not straightforward and transparent
  • Allow disrespectful or discriminatory behaviour
  • Knowingly use Serco’s resources for personal gain
  • Break our Code of Conduct or the law
  • Falsify or misrepresent information
  • Ignore and don’t speak up when we see something wrong
  • Choose to ignore adverse criticism
  • Blame others for mistakes we have made or things we have missed
  • Shift our responsibilities to others
  •  

    Why do so few companies measure Trust?

    How many companies measure have identified Trust as a core company value and measure it in a systematic way? The short answer is that very few B2B companies measure Trust at all. Serco is one of the few that even identifies it publicly as a core value. Isn’t that strange? Business magazines and articles are full of ideas and tips for becoming trusted advisors. A lot of CEOs and company boards talk about “trusted relationships” with clients in their annual reports to shareholders.

    Trusted Relationships

    Interestingly, the same CEOs and boards talk about trusted relationships but then quote the company’s Net Promoter Score (NPS). Now don’t get me wrong. There’s nothing wrong with NPS but it’s not a measure of Trust. It’s a measure of Advocacy. Yes, the two are related but it you’re going to talk to shareholders and clients about “Trusted Relationships” or “Acting as Trusted Advisors” then you really should go and measure your performance directly.

    Sometimes NPS isn’t enough. It’s a good metric – simple and easy to understand. But it’s one-dimensional. If you really want to understand how trusted a relationship you have with your clients, you need to measure Trust as well as NPS of CSat (Customer Satisfaction). As a CEO or Sales Director, you need to understand if your key clients are Ambassadors who trust you implicitly, or Stalkers and Opponents who want to get out of the relationship because levels of Trust (and Commitment and Satisfaction) are so low.

    If you want to know more about measuring Trust, have a read of this blog.

    Alternatively, get in touch with us today.


    Liverpool F.C. has a Net Promoter Score of -45

    When will Liverpool win the Premiership?

    It’s still January but Liverpool are already 16 points ahead of the chasing pack in the English Premier League. This been a phenomenal season for Jürgen Klopp’s team so far: 21 wins out of 22 games. No defeats. They even have a game in hand over their nearest rivals Manchester City and the club’s position look unassailable. So it might seem a little strange to claim that Liverpool’s NPS is -45%. Yes, that’s a Net Promoter Score of MINUS 45. It’s true. Sort of.

    Liverpool have been English champions 18 times but have never won the Premiership. The last time they won was way back in 1990 when the old First Division had a lot more teams than it does today. Three decades on, the discussion is not around whether Liverpool can win the Premiership this season.

    The question being posed is when? And with how many games to spare?

    And yet, Liverpool’s NPS score is -45%.

    Honestly, it really is Minus 45. Well, sort of.

    Liverpool 2 – 0 Manchester United

    Last weekend, Liverpool beat Manchester United 2-0 in a game that was far more one-sided that the final scoreline suggested.

    Liverpool's NPS is -45%

    Dave Hytner of the Guardian was in no doubt about the emphatic nature of the victory:

    “This was a game in which Liverpool’s superiority was so pronounced for most of the first half and the early part of the second it would have been no surprise had they led by five or six. The intensity of their football coupled with the surgical nature of their incisions were enough to take the breath.”

    Now here’s the interesting thing, and the central point of this blog.

    Given the imperious nature of Liverpool’s victory over Manchester United, one might think the Guardian would give all the Liverpool players ratings of 9/10 or 10/10 for their performances. Absolutely not. In the UK – in fact, all across Northern Europe – we just don’t do that. It’s not in our nature. Our internal scoring mechanism doesn’t allow it. We are conditioned to reserve 10/10 ratings for performances in the Superhero category. Excellence just gets you 8/10.

    So if we were to apply a Net Promoter Score-type rating to the Liverpool team after last weekend’s defeat of Manchester United, the Liverpool team would have received a NPS score of -45 according to John Brewin of the Guardian.

    Liverpool Player Ratings

    Here’s John Brewin’s full list of Liverpool player ratings:

    Alisson: A watching brief for much of the first half, busier but never truly troubled in the second
    6 (Remember that 6/10 is a ‘Detractor’ in NPS terminology)

    Trent Alexander-Arnold: Prevented from getting forward as often as he likes to, usually by United’s split-striker tactics
    6 (Detractor)

    Joe Gomez: Another solid performance as the junior but now regular central defensive partner to Van Dijk
    7 (7/10 and 8/10 are ‘Passive’ scores in NPS terminology)

    Virgil van Dijk: Headed in an opener against the early run of play, and marshalled the backline in style
    7 (Passive)

    Andy Robertson: His usual influence was muted in the first half before normal service resumed after the break
    6 (Detractor)

    Alex Oxlade-Chamberlain: Something of a passenger in first half, his substitution was little surprise
    5 (Detractor)

    Jordan Henderson: His energy kept his team driving forward, hit the post early in the second half
    8 (Passive)

    Georginio Wijnaldum: Had a goal disallowed for offside and his darts from deep wreaked havoc on United
    7 (Passive)

    Mohamed Salah: Missed a golden chance in the 48th minute then broke United duck in added time
    7 (Passive)

    Roberto Firmino: Had a goal disallowed by VAR, and he is still yet to score a goal at Anfield this season
    7 (Passive)

    Sadio Mané: His best chance, just before half-time, was well saved by De Gea. Otherwise unusually quiet
    6 (Detractor)


    Liverpool’s NPS is -45%

    The best ranking went to Jordan Henderson who only managed to get 8/10 from the Guardian correspondent. Even goal scorers Virgil van Dijk and Mo Salah could only manage a paltry 7 out of 10.

    11 Players; None achieved a score consistent with a ‘Promoter’ ranking of 9 or 10s; Six Passives (scores of 7 or 8) ; Five Detractors (scores of 6 or below).

    Net Promoter Score = % of Promoters (0%) less % of Detractors (45%), hence a Net Promoter Score of -45.

    Cultural Differences from Country to Country

    I have written before about how benchmarking needs to be conducted carefully when you compare scores from customers in different countries.

    I have also written about how people in different countries are culturally programmed to score in particular ways. The most obvious example is that Americans are more prone to score more positively than Europeans if they receive a good service.

    This is an important point to remember if you are running a Customer Experience (CX) programme across a global client base. An average NPS score for Northern European B2B customers is no higher than +10. For American customers, it’s more like +20 or +30, a score that would be seen as ‘excellent’ in a Northern European context.

    So be careful when comparing NPS scores across different jurisdictions. If it helps, just remember that Liverpool’s NPS was -45% in a year where they ran away with the Premiership title!

    UPDATE (2 February 2020)

    I am happy to say that following their 4-0 demolition of Southampton yesterday, Liverpool’s NPS score has improved to -9 (MINUS 9).

    Alisson – 7 (out of 10)
    Trent Alexander-Arnold – 6
    Joe Gomez – 6
    Virgil van Dijk – 7
    Andy Robertson – 7
    Fabinho – 7
    Jordan Henderson – 8
    Georginio Wijnaldum – 6
    Mohamed Salah – 9
    Roberto Firmino – 8
    Alex Oxlade-Chamberlain – 9 (Man of the Match)